The EGYM BioAge is a comprehensive fitness and health indicator
The EGYM BioAge
For members to understand how their exercise positively impacts their fitness and health, it’s crucial to make progress visible at every step. The EGYM BioAge is a comprehensive fitness and health indicator that combines a wide range of user measurements into an easy-to-understand BioAge that can be compared to a member's physical age.

Reading Time
About 10 Min.
Share Why does BioAge exist?
EGYM’s ambition as a global digital fitness technology is to make the gym work for everyone.
Everybody knows that physical workouts have a positive impact on health, but nobody knows to what extent. The biggest challenge is to address the fundamental questions members ask themselves: How can I motivate myself to work out regularly? What is my current health status? What is the best way to get healthier? How do I measure the positive impact of exercise on my health and stay on track with my routine?
This is where the EGYM BioAge comes into play. It provides:
- Sophisticated assessments based on scientific findings of the current health status of a member
- Structured and target-oriented individual training guidance
- Tracking and visualization of the positive impact of exercise on health
Other elements of our approach complement the EGYM BioAge as a comprehensive health and fitness indicator. For example, our Activity Points and Activity Levels help reward members for being active even before changes in health and fitness are measurable and build a healthy habit of exercising regularly.
What does the EGYM BioAge mean?
To calculate the BioAge, EGYM uses a sophisticated analysis of various scientifically proven factors that directly relate to physical performance, health, and immune system status - that’s why we also call it a holistic approach. Simultaneously, EGYM has the unique proposition of having access to a massive data pool for reference. It, therefore, provides a highly reliable and benchmarked calculation with a million data points collected over the years, enabling EGYM to optimize the analysis further and make it even more precise over time, supporting members in achieving their fitness and health goals.
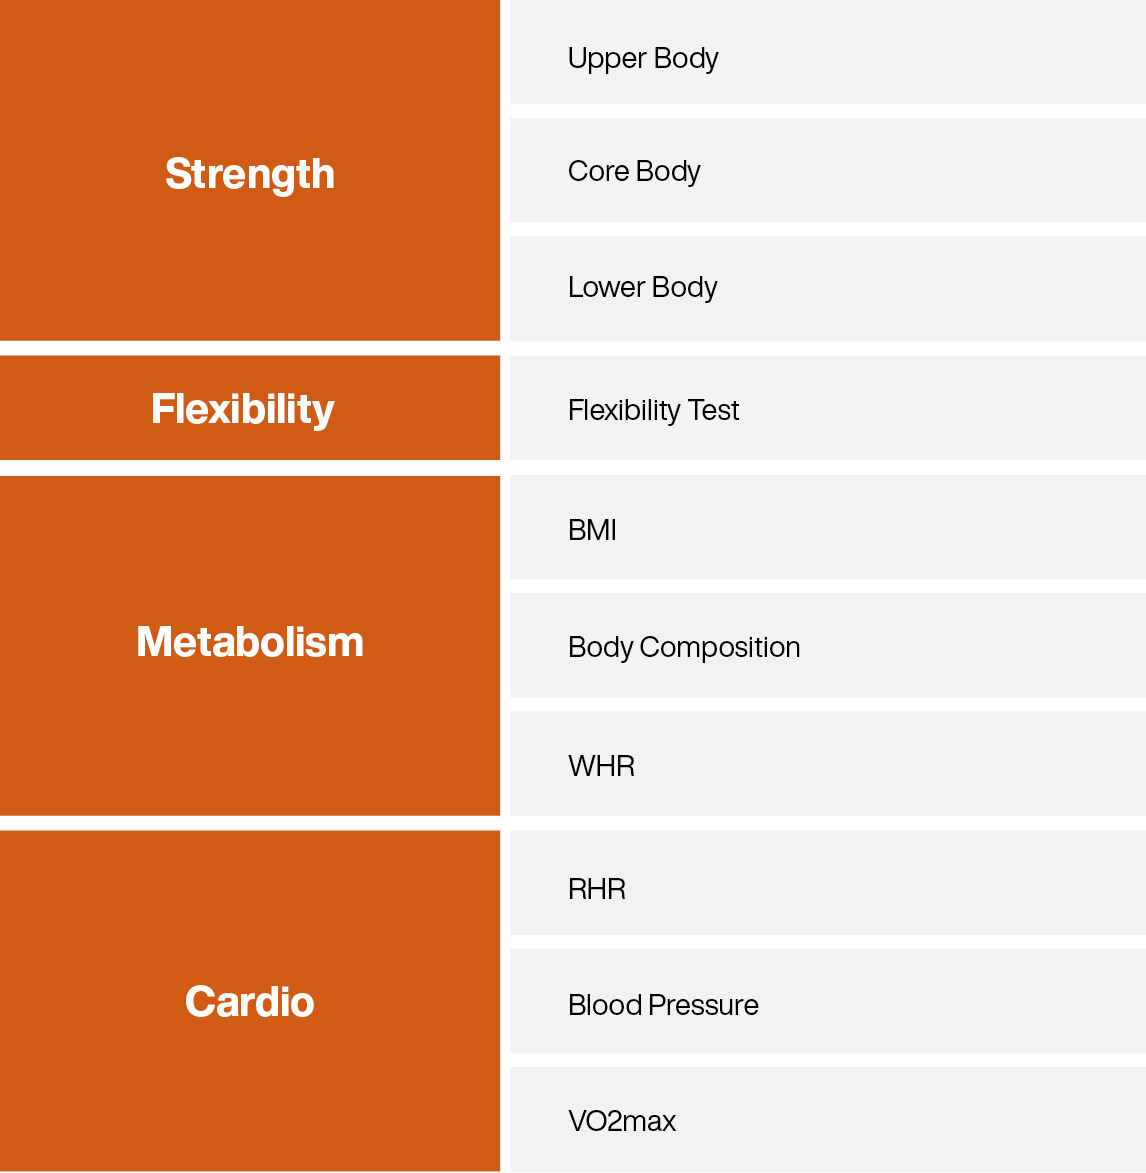
The EGYM BioAge combines a variety of measures and health parameters, categorized into four areas:
- Strength
- Flexibility
- Metabolism
- Cardio
How does the value of the BioAge come about?
The BioAge shows how members perform in comparison to the typical average values of their real age group. For example, the strength value, the output achieved on an EGYM Smart Strength machine, is compared with the available data sets of various age groups. Flexibility finally becomes reliably measurable thanks to the EGYM Fitness Hub. The values for "cardio" and "metabolism" can be measured via compatible partner devices.
For example, a 50-year-old member achieves a performance that corresponds to the average of all 45-year-olds. This results in a younger biological age - 45 years. Conversely, of course, the same is true: a poorly trained 30-year-old who only achieves the average maximum power output of all 40-year-olds in comparison is correspondingly biologically already 40 years old.
How does BioAge impact Health?
Strength Value
The Strength Value sets the user’s body weight in relation to his strength.
Strength is the foundation of a person to perform mechanical work, to exert forces and torques. A loss of muscle mass and strength can cause various metabolic and cardiovascular problems, like decreased bone density, fat gain, and diabetes (Westcott, 2012). Furthermore, the impact of sarcopenia (loss of muscle mass and strength) is a widespread problem in modern populations that can be effectively delayed with resistance training (Morley et al., 2011). Strong muscles also function as an endocrine organ that produces protective myokines that rejuvenate the immune system (Nieman and Wentz, 2019).
Metabolism Value
The Metabolism Value gives further insight into the health status by relating weight, fat, and height. It is calculated by the Body Mass Index (BMI), Body Composition, and Waist-Hip-Ratio (WHR). BMI is a very popular, easy-to-calculate health indicator. An excellent metabolic status is also an indicator of a well-functioning immune system (de Heredia et al., 2003). Being combined with body-fat-percentage and waist-to-hip-ratio, it specifies the prediction level for the user`s metabolism significantly.
- The body fat percentage relates the body fat to the total body mass. A body fat percentage within the normal range is the main contributor to prevent metabolic syndrome (Zhu et al., 2003). Additionally, it is associated with reducing the risk of cardiovascular disease and lower the incidence risk for cancer (Britton et al., 2013 and De Koning, 2007).
- The Waist-to-Hip Ratio as an estimation for abdominal fat distribution is associated with cardiovascular diseases and events. (De Koning et al., 2007). An even better prediction is concluded when the measurement results can be combined with BMI measurement, like for the EGYM BioAge (WHO, 2011). The Waist to Hip Ratio is calculated by dividing the waist circumference by the hip circumference.
- A BMI factor within the proposed norm range is related to reduced risk factors for cardiovascular diseases, diabetes, hypertension, dyslipidemia, and all-cause mortality (U.S. Department of Health and Human Services, 2013). The BMI is defined as a person’s weight in kilograms divided by the square of the height in meters (kg/m²).
Cardio Value
The Cardio (Cardiovascular) Value combines the Resting Heart Rate, Blood Pressure, and the VO2max. It gives an overview of cardiovascular capacity, performance, and health. A healthy cardiovascular system is also connected to a robust immune system (Kullo et al., 2007). These methods are used in general in medical practice to determine the state of health.
- The VO2max is the most precise measure of cardiovascular fitness and is widely used for assessing the status of athletes. A higher VO2max comes with a greater body ability to transfer and consume oxygen (Hawley,1992).
- A high Blood Pressure can indicate underlying diseases and may have long-term effects like heart attack, stroke, and kidney failure. (Williams, 2018; Frese, 2011).
- A low Resting Heart Rate (RHR) is a good indicator of cardiovascular fitness (Silva, 2018). Therefore lower RHR values predict a lowered risk for coronary heart diseases, myocardial events, and general cardiovascular disease mortality (Fox et al., 2007).
Flexibility Value
The Flexibility Value represents a user’s overall flexibility range in comparison to a peer group. It includes a granular overview of the flexibility of certain muscle groups. This overview also indicates whether there are any imbalances in a user's flexibility. The user can see the raw angles of all performed flexibility tests via Fitness Hub or partner devices, including improvements to the last time this test was performed and whether the current score is a good, average, or bad one compared to a normalized score of the user’s age. Additional information about the health impact and context of the flexibility tests is provided on-screen, including specific workout recommendations to improve flexibility based on individual results.
- It has been well established that flexibility declines with age. It’s been shown that the flexibility decreases by 20-30% between the ages 30 and 70 years (Adams et al., 1999). This has been proven not only for the overall flexibility but also for specific joints which show a decline in the range of motion, e.g., neck flexion (Lind et al., 1989; Youdas et al., 1992), or torso lateral flexion (Fitzgerald et al., 1983)
- Flexibility is critical for daily life and athletic performance. It helps a “person meet the functional demands of life as well as enhances the person’s participation in leisure activities.” (Adams et al. 1999). Conversely, a “(l)ack of flexibility may increase injury rate and may cause functional problems, particularly in the sedentary, middle-aged and elderly” (Adams et al. 1999).
- The reasons or underlying mechanisms for the loss of range of motion are loss of sarcomeres, not only in parallel but also in series (Narici et al., 2003)
The flexibility value’s current logic is based on existing scientific literature, EGYM-internal tests, and our beta-testing partner-gyms. However, over time we expect to gather the world’s largest database for flexibility and can therefore further expand the validity of the flexibility value, its relation to age, and continue to optimize its usability.
Fitness Hub keeps members motivated by turning complex data into easy-to-understand success metrics, like EGYM’s BioAge.
Learn MoreLiterature & Sources
Adams, K., O'Shea, P., & O'Shea, K. L. (1999). Aging: its effects on strength, power, flexibility, and bone density. Strength and conditioning Journal, 21, 65-77.
Britton, K.A.; Massaro, J.M.; Murabito, J.M.; Kreger, B.E.; Hoffmann, U.; Fox, C.S. (2013). Body fat distribution, incident cardiovascular disease, cancer, and all-cause mortality. Journal of the American College of Cardiology 62(10): 921-925.
De Koning, L., Merchant, A. T., Pogue, J., & Anand, S. S. (2007). Waist circumference and waist-to-hip ratio as predictors of cardiovascular events: meta-regression analysis of prospective studies. European heart journal, 28(7), 850-856.
Fitzgerald, G. K., Wynveen, K. J., Rheault, W., & Rothschild, B. (1983). Objective assessment with establishment of normal values for lumbar spinal range of motion. Physical therapy, 63(11), 1776-1781.
Fox, K., Borer, J. S., Camm, A. J., Danchin, N., Ferrari, R., Sendon, J. L. L., ... & Heart Rate Working Group. (, 2007). Resting heart rate in cardiovascular disease. Journal of the American College of Cardiology, 50(9), 823-830.
Frese, E. M., Fick, A., & Sadowsky, H. S. (2011). Blood pressure measurement guidelines for physical therapists. Cardiopulmonary physical therapy journal, 22(2), 5.
Hawley, J.A., and Noakes, T.D. (, 1992). Peak power output predicts maximal oxygen uptake and performance time in trained cyclists. European Journal of Applied Physiology, 65: 79-83.
de Heredia, F.P.; Gómez-Martínez, S.; Marcos A. (2003). Obesity, inflammation, and the immune system. Proceedings of the Nutrition Society. 71(2): 332-338
Kullo I.J.; Khalegh, M.; Hensrud, D.D. (2007). Markers of inflammation are inversely associated with V̇o2 max in asymptomatic men. Journal of Applied Physiology. 102(4): 1374-1379
Lind, B., Sihlbom, H., Nordwall, A., & Malchau, H. (1989). Normal range of motion of the cervical spine. Archives of physical medicine and rehabilitation, 70(9), 692-695.
Morley, J. E., Baumgartner, R. N., Roubenoff, R., Mayer, J., & Nair, K. S. (2001). Sarcopenia. Journal of Laboratory and Clinical Medicine, 137(4), 231-243.
Narici, M. V., Maganaris, C. N., Reeves, N. D., & Capodaglio, P. (2003). Effect of aging on human muscle architecture. Journal of applied physiology, 95(6), 2229-2234.
Nieman DC, Wentz LM. 2019. The compelling link between physical activity and the body's defense system. Journal of Sport and Health Science. 8(3): 201-217.
Silva, D. A. S., Lima, T. R. D., & Tremblay, M. S. (2018). Association between resting heart rate and health-related physical fitness in Brazilian adolescents. BioMed research international, 2018.
Westcott, W. L. (2012). Resistance training is medicine: effects of strength training on health. Current sports medicine reports, 11(4), 209-216.
World Health Organization. (, 2011). Waist circumference and waist-hip ratio: report of a WHO expert consultation, Geneva, 8-11 December 2008.
Youdas, J. W., Garrett, T. R., Suman, V. J., Bogard, C. L., Hallman, H. O., & Carey, J. R. (1992). Normal range of motion of the cervical spine: an initial goniometric study. Physical therapy, 72(11), 770-780.
Zhu, S.; Wang, Z., Shen, W.; Heymsfield, S.B.; Heshka, S. (2003). Percentage of body fat ranges associated with metabolic syndrome risk: results based on the third National Health and Nutrition Examination Survey (1988-1994). The American Journal of Clinical Nutrition. 78(2): 228-235